DFA (detrended fluctuation analysis) alpha 1 is an HRV (heart rate variability) based aerobic and anaerobic threshold estimation method. It only requires a heart rate monitor that tracks HRV data. It has the potential to track your thresholds automatically without dedicated test workouts.
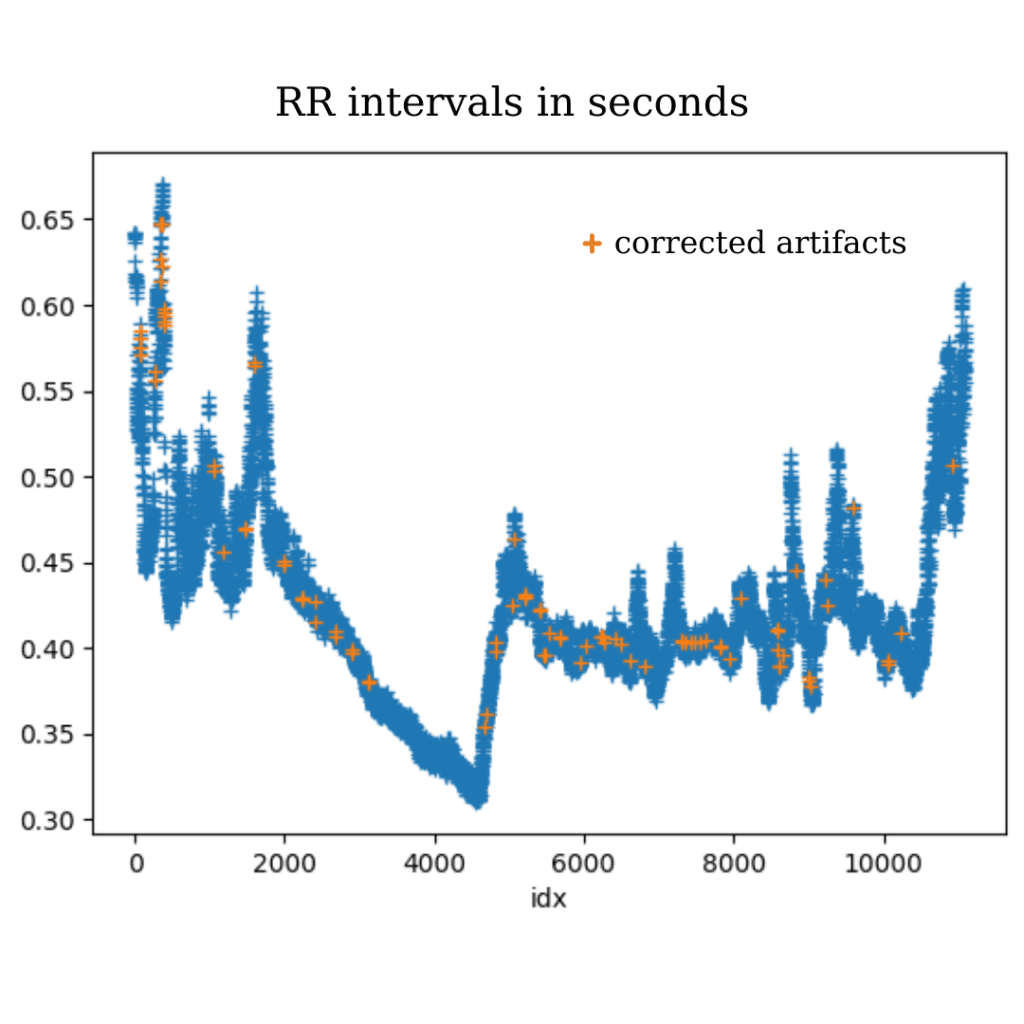
DFA alpha 1 is based on DFA of your HRV data. Your HRV data is a list of the exact times between each successive heart beat. It contains more information than your simple, averaged, heart rate data. For example, take a heart rate of 60 bpm. This is your heart rate if your heart beats exactly in 1 second intervals. But it would also be 60 bpm if the time between beats is 0.9, 1.1, 0.8, 1.2, ... seconds. We usually refer to the time between beats as RR intervals.
HRV is mainly utilized as a recovery metric, see for example this the5krunner post, or this Firstbeat post. Using DFA alpha 1 HRV data for threshold detection is fairly new.
Both recovery and DFA alpha 1 threshold detection are very sensitive to HRV artifacts. Artifacts are missed, short, extra, and ectopic beats. Artifact correction is crucial for a meaningful analysis of HRV data. We at AI Endurance have implemented our own artifact correction system and cross checked it against Kubios, the current gold standard in HRV analysis. To work with as little artifacts as possible, the Polar H10 is the recommended heart rate monitor at this point. Generally, we consider data with less than 5% artifact contamination to be acceptably clean.
This paragraph is about to get a little technical but we will provide a more intuitive explanation right after. DFA measures the self-similarity of a data set after removing the long term (>25 seconds) trends. In practice, it boils down to:
Ultimately what this is saying is that DFA alpha 1 can be interpreted as the noise index of the underlying data set. Larger values of alpha 1 indicate more correlation over different scales, while lower values indicate less correlation, and in a sense more chaotic and random data.
[1] hypothesized that the beating of the heart becomes more chaotic as it is exposed to increased acute exercise induced stress. The studies of [2] and [3] further established this connection by comparing oxygen intake (to detect the ventilatory aerobic and anaerobic thresholds) vs ECG (and later wearable heart rate monitor [4]) data.
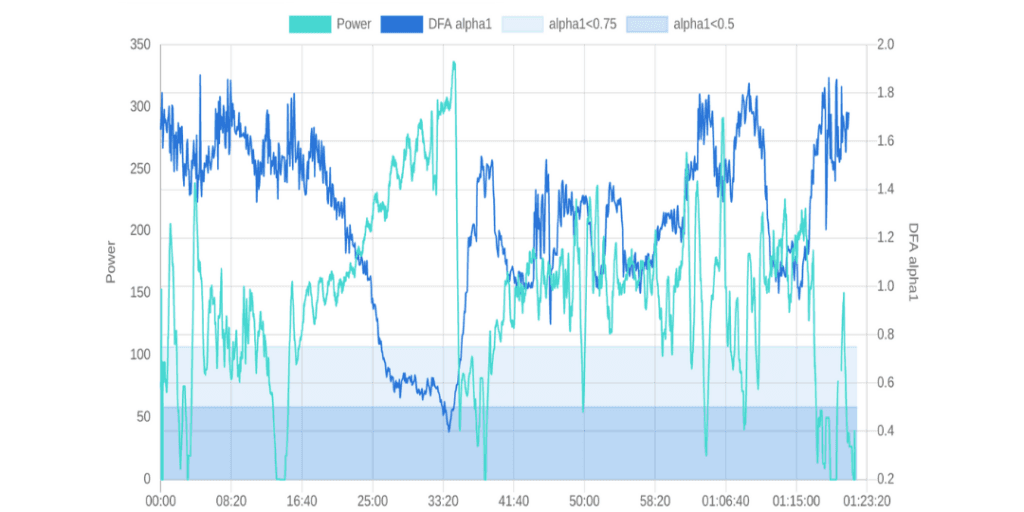
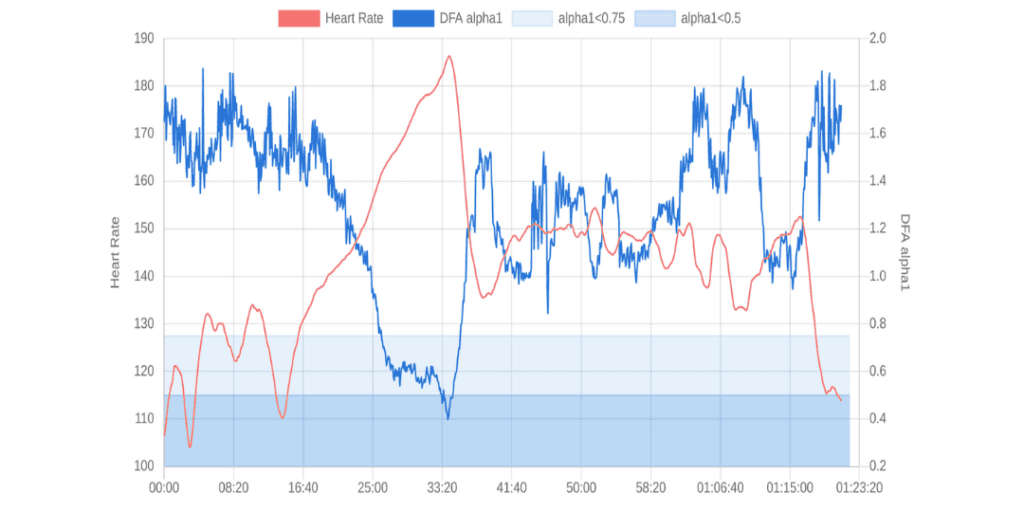
The main result: DFA alpha 1 drops below 0.75 at the aerobic threshold and below 0.5 at the anaerobic threshold.
AI Endurance calculates DFA alpha 1 at high, Kubios-like accuracy, see for example this review by Bruce Rogers.
For more information check out the original publications on DFA alpha 1 threshold determination [1-4]. You can also find great content on this topic on
DFA alpha 1 has the potential to be a breakthrough for HRV based aerobic and anaerobic threshold detection for the following reasons:
The following two figures show DFA alpha 1 vs power/heart rate for an activity with a ramp test from 16:40 to 33:20.
To find out how to track your DFA alpha 1 thresholds with AI Endurance, check out this blog post.
With DFA alpha 1 HRV based aerobic and anaerobic threshold detection, we are able to detect thresholds even without dedicated test protocols/workouts. This is possible for the following reason: DFA alpha 1 will cross 0.75 and later 0.5 at some point during an activity if the intensity is high enough.
We can detect thresholds via two different strategies:
We attempt to detect ramps of increasing intensity in every workout. Here, the ramping up of intensity has to be slow enough for your cardiovascular system to steadily adapt to the intensity. If the ramping up is too fast, there is a lag in your cardiovascular response relative to your pace/power output [5]. The ramp has to occur during the first 30 minutes of the activity as fatigue might settle in afterwards.
The works of [2] and [3] used ramps to empirically detect the correlation between ventilatory thresholds and DFA alpha 1.
A cluster threshold is the average of all pace/power values recorded during the first 45 minutes (for running; 1 hour for cycling) of an activity where the DFA alpha 1 values cluster close to 0.75 for aerobic thresholds (0.5 for anaerobic). If a sufficient amount of time is spent near either threshold, the average pace/power during this time close to threshold corresponds to a cluster threshold.
Cluster thresholds are detected more often than ramps: on average, we detect aerobic cluster thresholds for about 40% of all activities with high quality HRV data while we detect aerobic ramps in about 15%. We detect anaerobic cluster thresholds in about 15% of activities while anaerobic ramps manifest themselves in about 5% of activities.
While cluster thresholds were not studied yet in the research literature, our internal research at AI Endurance shows strong correlation between cluster thresholds and ramp thresholds studied in [2] and [3]. Until on a more solid research foundation, our AI prioritizes ramp thresholds over cluster thresholds.
DFA alpha 1 is an HRV based metric to determine your aerobic and anaerobic thresholds. It is easily accessible and non-invasive. Tracking DFA alpha 1 only requires wearing a heart rate monitor that records high quality HRV data.
DFA alpha 1 allows us to track your fitness state consistently in an automated way without test protocols. More often and without the dread of fitness tests. Frequent automatic threshold detection leads to more data to correlate your training variables with your fitness state. Hence, we have more data to feed to your digital twin and improve your AI Endurance performance predictions.

Coaching for runners can help you train smarter and reduce injury risk. Here's what you can expect from coaching, how it can help, what you can do to become a better athlete, and the differences between AI and traditional coaching.
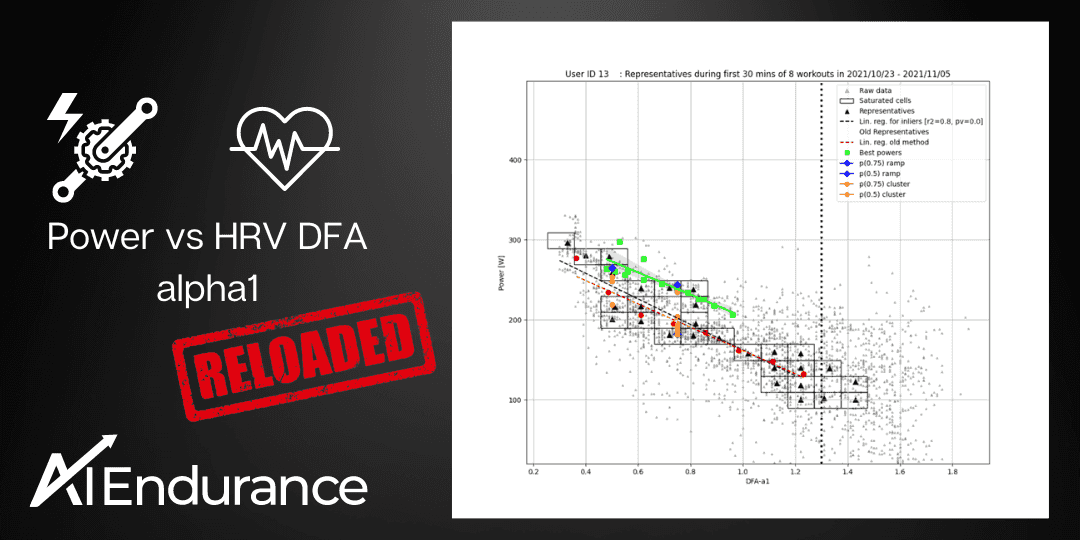
by Stefano Andriolo. Building on previous work, we refine a method to accurately determine the relationship between DFA alpha 1 and power. This method can be used to track fitness and thresholds of an athlete. We find in some cases ramp detection tends to overestimate thresholds, a finding mirrored in recent physiological papers. On the other hand, thresholds based on clustering of DFA alpha 1 values tend to agree well with this new method. We propose a hybrid lab and everyday workout experiment to further study the relationship.
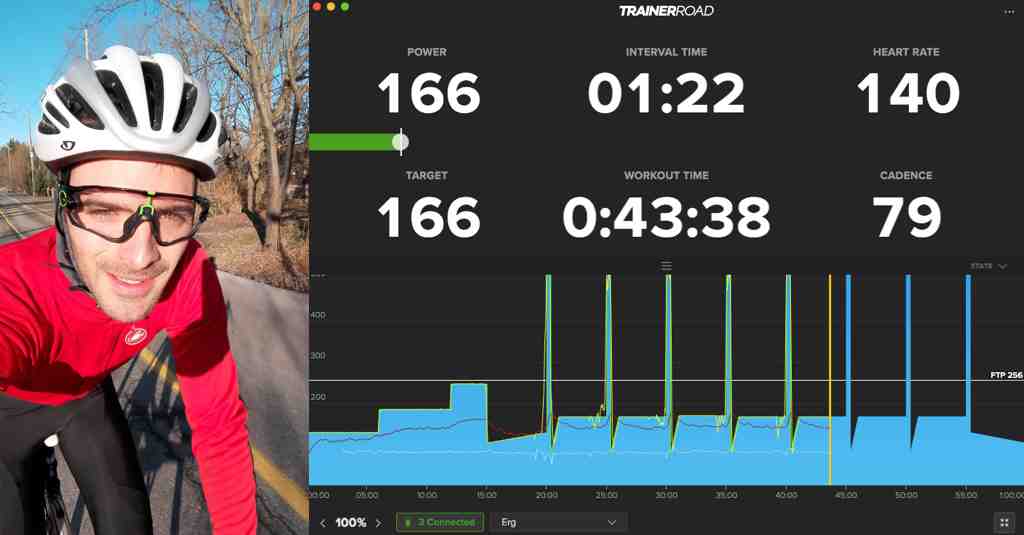
In this post, we explain how to use AI Endurance’s cycling training plan that we generated for Paris to Ancaster, Canada’s biggest gravel racing event. The plan includes detailed workout instructions. For indoor cycling, we show how to use AI Endurance with Trainerroad and Zwift.

When it comes to sport and fitness, it’s not all about training hard but it’s about training smart. We are often asked about training plans and if they are worth your money to invest in them.