
Published Aug 28, 2024 · Updated Jan 16, 2025
by Stefano Andriolo, Markus Rummel and Iñigo Tolosa. We present a new real time feature of evaluating readiness to train based on in-activity heart rate variability (HRV) measurements during the warm up of your activity. You can use this feature in the newest version of the alphaHRV Garmin Connect IQ app at no additional cost.
Daily readiness to train can vary and depends on a variety of factors including sleep, stress, sickness and response to training load. Morning and overnight HRV readings measured via Oura ring, Garmin watch or Whoop band are important data points towards this. But what if
Ideally, we'd like to assess readiness right before the workout or after the warm up. This is now possible via a cooperation between alphaHRV and AI Endurance:
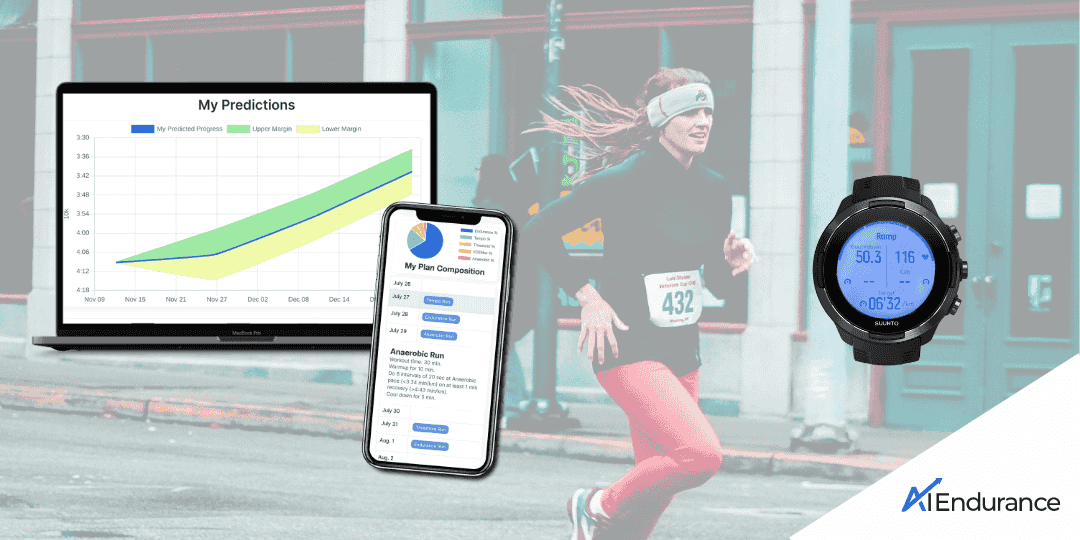
You can now get your workout readiness in real-time 10 min into your run (20 min for cycling) from the alphaHRV app.

This allows you to make modifications to your workout. For example, if you have a hard interval session planned and your readiness is low, it may be wise to skip and do a low intensity session instead. You may also shorten your planned duration and expose your body to less stress when your readiness is low.
In AI Endurance, in-activity HRV readiness to train based on DFA alpha 1 is now calculated with the same algorithm as in alphaHRV to give you an optimal experience of using both apps together.
Here's a checklist on what you need to do:
For running, alphaHRV always uses pace even when you are recording running power because the latter is not available in real-time in the CIQ app. Whenever we are referring to 'pace', we mean Grade Adjusted Pace (GAP).
Real-time readiness is based on in-activity HRV data, specifically the DFA alpha 1(a1) metric.
DFA alpha 1 is an index that reflects the noise spectrum of your heart, derived from HRV data. It serves as an indicator of internal effort and exercise stress: a lower a1 value suggests your body is experiencing more acute exercise stress. Specifically, if a1 falls below 0.75, it indicates crossing the aerobic threshold. If it drops further below 0.5, it signals crossing the anaerobic threshold [1-4]. See here for a detailed explanation of a1 and here for how to benefit from using a1 in AI Endurance.
alphaHRV can calculate a1 in real-time on your Garmin device so you can monitor how hard you are working and if you are crossing the (an-)aerobic threshold.
Here’s the basic approach for the calculation:
Here's a couple of examples where we visualize the calculation:

Calculation of real-time readiness for a cycling activity today (red) vs historic activities during the last 21 days (purple).

There's two sources of evidence that led to the final form of our algorithm to calculate real-time readiness:
In the scientific literature, it has been observed that a1 declines for the same intensity measured via power or pace as the duration of the exercise increases, i.e. fatigue builds [5, 6]. It was also observed that on a day after running an ultra marathon, a1 was significantly suppressed relative to the day of the ultra marathon at the same pace [7]. In fitness tests with two identical successive ramp tests, the second fatigued ramp test showed suppressed a1 [8].
AI Endurance has access to a dataset where athletes have given permission for the data to be used for anonymized research [9]. Our data supports the above results published in the scientific literature, specifically the suppression of a1 for given power/pace as fatigue is accumulated.
We have also compared using the same algorithm with heart rate instead of a1. We generally find correlation between the heart rate readiness and a1 readiness but only a1 readiness shows correlation with time spent at intensity, heart rate does not. For this comparison, we extended the time period to calculate <a1> and <p> to 30 min, in order for intensity to have a chance to occur. This suggests that a1 suppression indeed correlates with fatigue as opposed to heart rate where such a relationship could not be established.
There's a few scenarios where we won't be able to calculate readiness because the meaningfulness of the calculation breaks down for various reaons:
AI Endurance uses whichever of the following two data sources has less artifact corruption to calculate DFA alpha 1:
The various HRM, Garmin, alphaHRV pairing options can be confusing and we have done what we can to make the two apps work together no matter the pairing options you are using. However, if you want to be sure to optimally record DFA alpha 1 in real time on top of AI Endurance's post-workout HRV analysis we recommend installing alphaHRV in the following configuration:
For background, we recommend pairing alphaHRV via ANT+ because it does not care about ANT+ or BLE for data quality (both equally good) whereas 'native' Garmin <> H10 connections provide bad HRV data in ANT+ mode if your heart rate is above 120 bpm. This is due to a questionable Garmin setting where they don't allow more than 2 data points per second in ANT+.
For more about using alphaHRV and AI Endurance together see this post by the5krunner.

When it comes to excelling in endurance sports such as triathlon, running or cycling proper nutrition plays a crucial role in maximizing your performance and achieving your goals. Whether you're swimming, cycling, or running, your body requires optimal fuel to meet the energy demands of these activities. In this blog post, we'll explore the importance of nutrition in triathlon, running, and cycling, followed by an introduction to the new feature of AI Endurance which provides recommendations for daily and activity specific nutrition requirements individualized for each athlete.
We show you in a few simple steps how to connect Suunto Guides with your AI Endurance account. You can get live workout instructions that are optimized to you by our AI. You can also easily determine your training zones and thresholds via a simple ramp test that utilizes your heart rate variability (HRV) data.
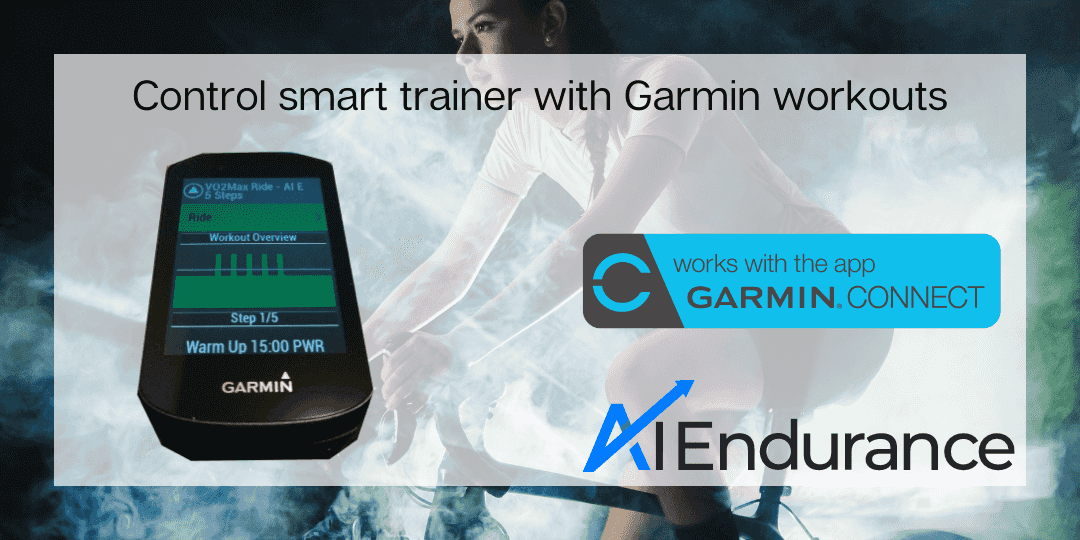
If you do not want to use Zwift or other virtual platforms, you can simply execute your AI Endurance cycling workouts by letting your Garmin control your smart trainer. For example, let your Garmin Edge 530 or Forerunner 945 control your Wahoo Kickr trainer. All smart trainers supporting the ANT+ FE-C protocol, including Tacx, are supported.
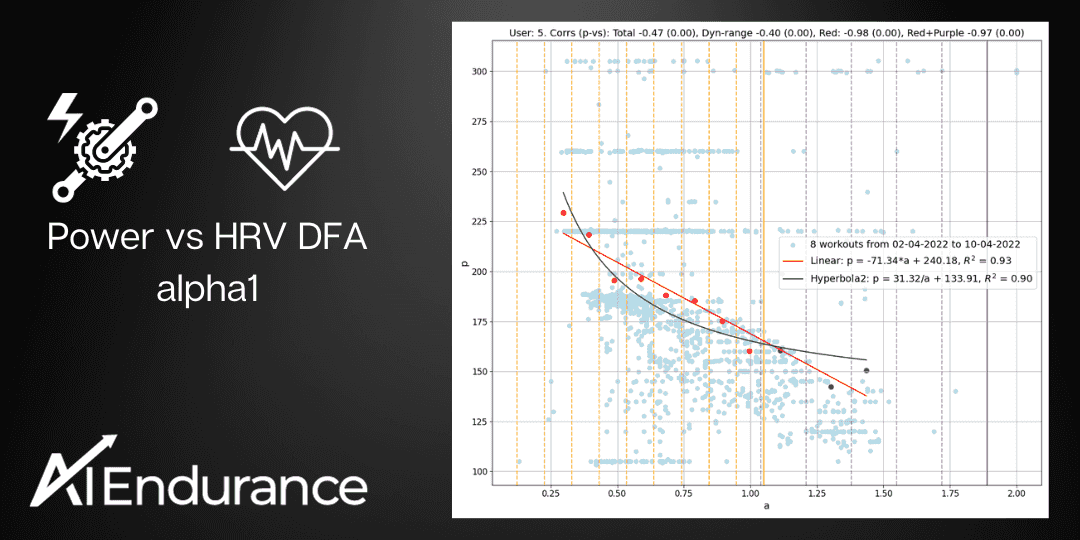
by Stefano Andriolo. We demonstrate a universal relationship between cycling power and DFA alpha 1 from every day workout data that allows accessible and regular tracking of aerobic and anaerobic thresholds without the need of an exercise lab or even a dedicated testing protocol.