Published Oct 5, 2026
by Markus Rummel. Last month I presented our durability research at the Science in Cycling symposium in Bromont, Quebec. The question behind the talk: can you measure how well an athlete holds up over a long ride from the data they already record in training, without a lab test? In other words, can you measure your cycling durability from everyday rides? The short answer is yes, and this post explains how, what we found, and why it matters for your training.
You can download the slides here (PDF). A full paper based on the talk will appear in the Journal of Science and Cycling; we will link it here once it is out.
Durability is how much, and how early, your physiology deteriorates during prolonged exercise [1]. Two riders with the same threshold power can look very different after three hours: one still rides at the same effort, the other has slowed down or has to work much harder for the same power. In long races that difference often decides the result.
Researchers measure durability in two ways [2]:
So far, almost all of this research comes from lab protocols (ride for hours at a fixed power, test before and after) or from professional race data. Lab protocols are one-off snapshots and nobody repeats them every two weeks. Amateur athletes, the vast majority of us, are hardly studied at all.
We used training data from 105 amateur cyclists and triathletes who consented to research use of their data: 4,850 rides recorded with a power meter and a chest strap clean enough for beat-to-beat heart rate analysis (fewer than 5% artifacts). Accumulated work is measured in kilojoules per kilogram of body weight (kJ/kg); for a 77 kg rider, 15 kJ/kg is about 1,150 kJ, roughly two to three hours of solid endurance riding.
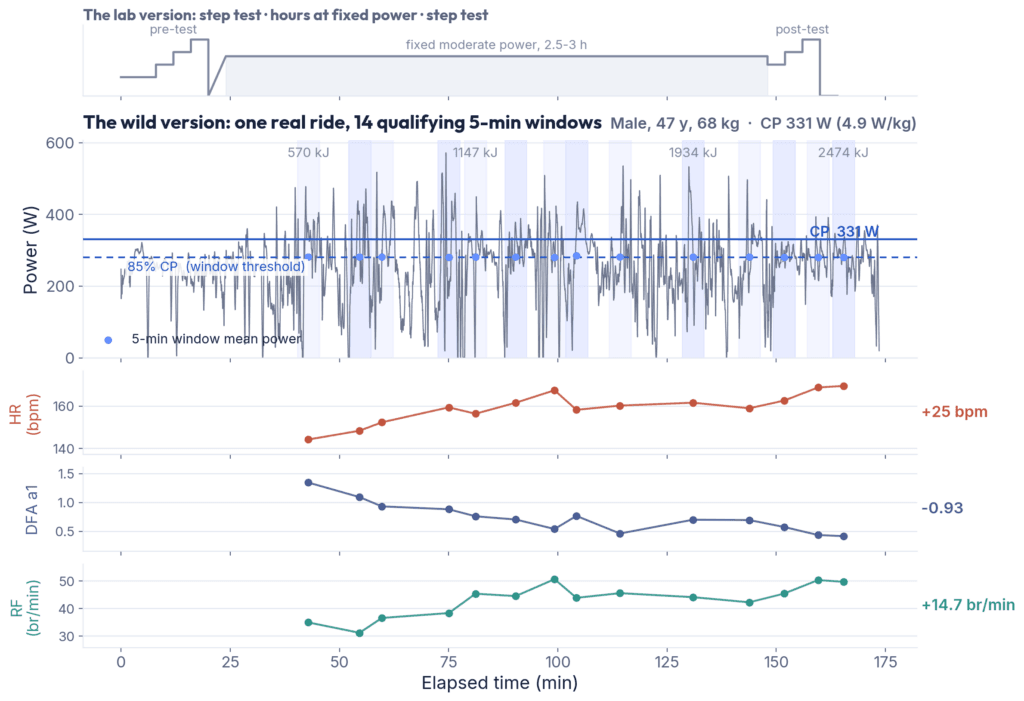
Within each ride we looked for 5-minute stretches at a meaningful intensity, at least 85% of the athlete's critical power (CP). We then compared stretches ridden at the same power (within 10%) early and late in the ride. If the power is the same but heart rate is higher later, that difference is durability, measured with no special test.
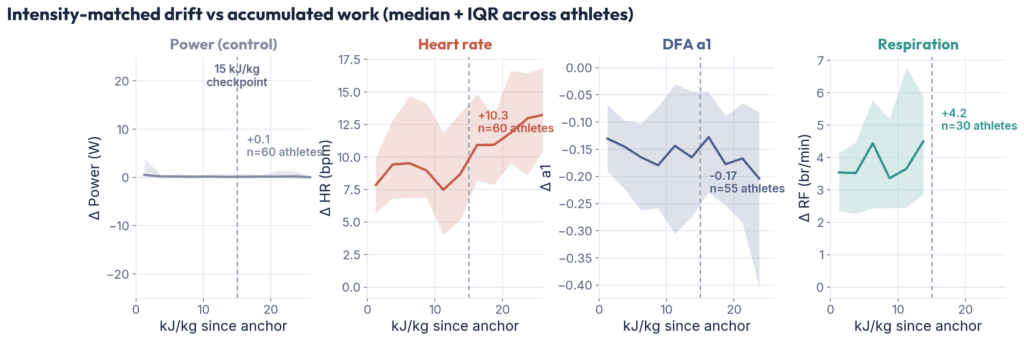
At the same power, the internal cost rises steadily. Comparing each ride's first hard 5 minutes with later stretches at the same power, after 15 kJ/kg heart rate was 10 bpm higher, DFA alpha 1 was 0.17 lower and breathing was 4 breaths per minute faster (median across athletes). Power itself barely moved, so this is not an intensity effect.
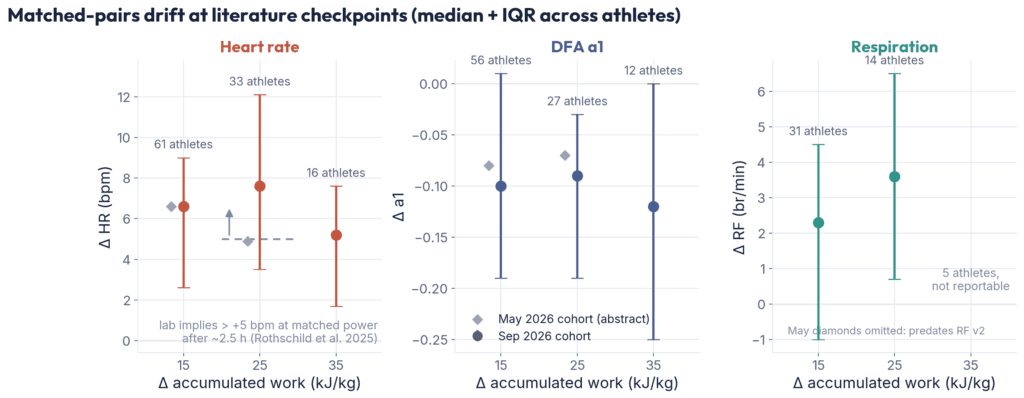
We also compared all pairs of same-power efforts within a ride, a design borrowed from the professional race studies [3, 7] but applied to heart rate and breathing instead of power. Heart rate drift was about 7 bpm at both 15 and 25 kJ/kg of work between the two efforts, and in line with what a recent lab study found after 2.5 hours of riding [6].
It is robust. The drift showed up whether we defined hard efforts as above 85%, 95% or 105% of CP, and when we matched power to within 2% instead of 10%. Rerunning everything on four months of newer data gave the same picture.
It is repeatable per athlete. Splitting each athlete's rides into two halves, the heart rate drift measure agreed well between the halves (correlation 0.72). Differences between athletes were larger than the measurement noise, so the measure tells athletes apart.
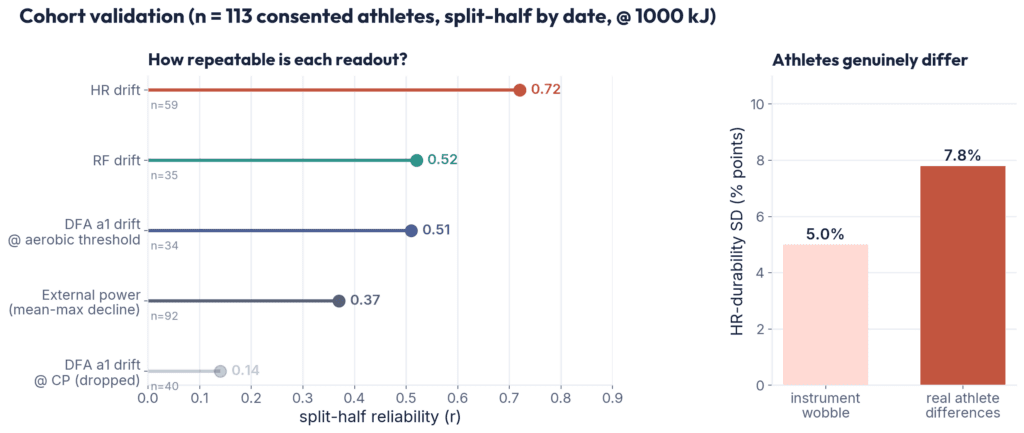
The obvious alternative is to check how much your best power drops late in rides. For pros that works, because racing forces maximal efforts after hours of work. For amateurs it mostly does not. Late in a training ride most of us do not go all out, so a lower late-ride power usually means we chose to ride easier, not that we could not ride harder. In our data this power-based measure was much less repeatable (correlation 0.37). Physiological durability only needs you to ride at a steady effort, which you do anyway. For amateur athletes it is not just the convenient way to measure durability; it is the one that works.
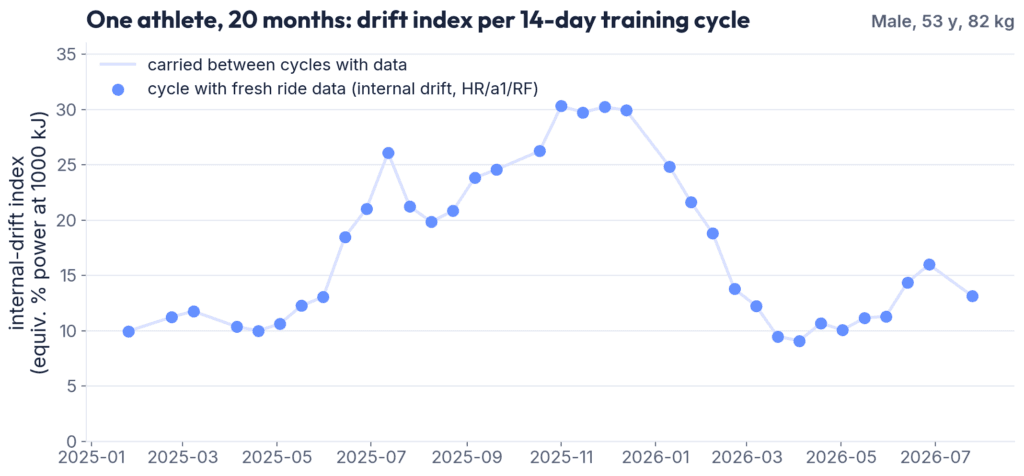
Because the measurement needs no test, it can be updated every two weeks from your normal training. Below is one athlete over 20 months: the durability estimate changes threefold within a season. Part of that is training, part is heat and accumulated fatigue, which is why the most useful comparison is you against your own baseline, not against other athletes.
If you train with a power meter and a chest strap, you are already recording everything needed to measure your durability. We are building this into AI Endurance so your training plan can track and target durability alongside your thresholds. Questions or thoughts? Join the discussion on our forum.
This work builds on our earlier study with Stefano Andriolo and Thomas Gronwald, relating cycling power and DFA alpha 1 from everyday workout data [8].

When it comes to triathlon training, nutrition plays a vital role in fueling your performance and optimizing your results. To help you reach peak performance, we have developed an advanced AI meal plan that takes into account your unique requirements, respects the calorie cost of your workouts, and accommodates your dietary preferences. With the power of evidence-based nutrition models, we ensure that your triathlon meal plan is tailored to support your goals.
by Markus Rummel. At AI Endurance, your optimized training plan has always been built on data — not guesswork. We start by crunching the numbers: analyzing your recovery, availability, and long-term progression to create an efficient, evidence-based plan.
Use Zwift custom workouts to grow your FTP with a data-driven, personalized Zwift custom training plan from AI Endurance.
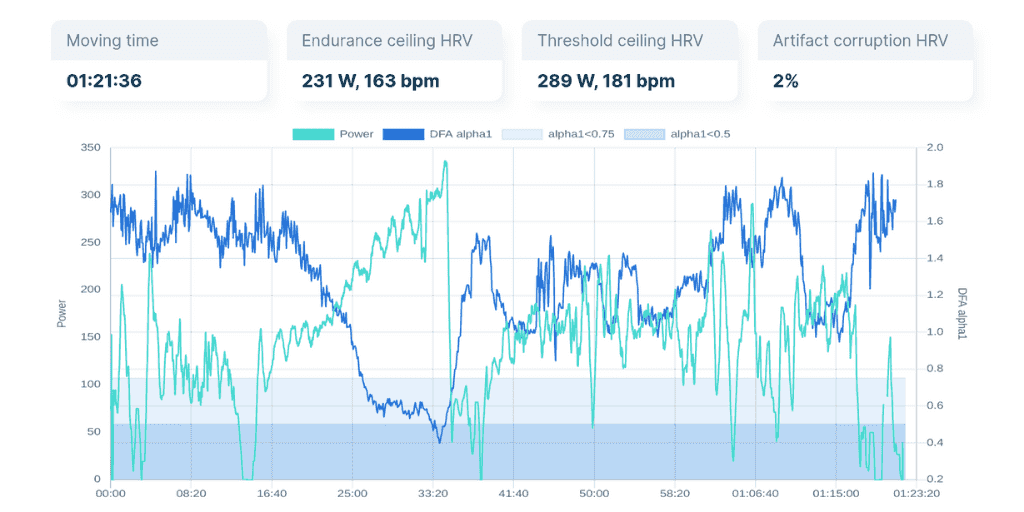
Track your aerobic and anaerobic thresholds from DFA alpha 1, the heart rate variability metric, with the AI Endurance app. This guide covers every device that records it: Garmin and Suunto watches and bike computers, the Hammerhead Karoo with our on-device extension, and the Apple Watch with Watchletic.

