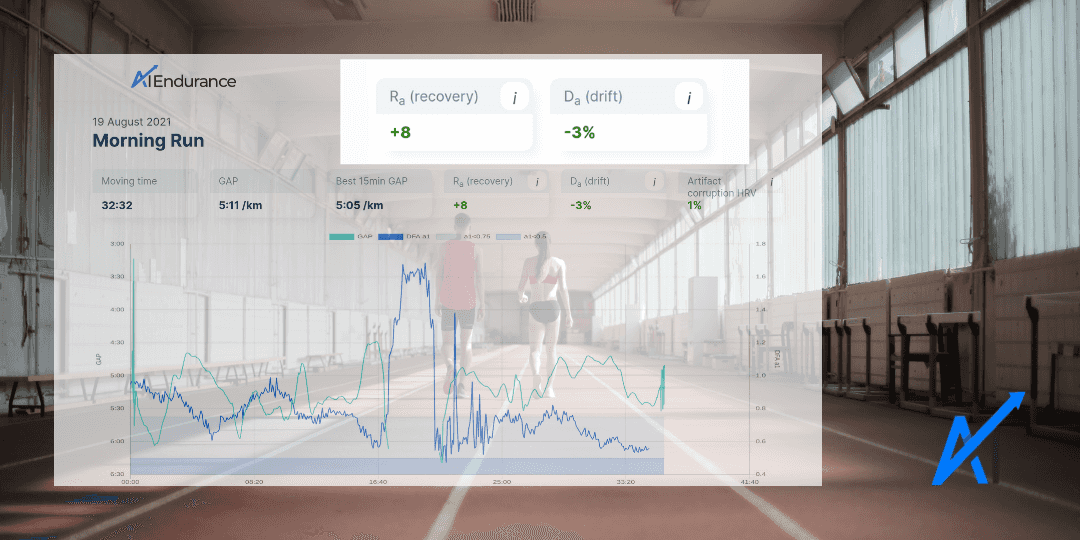
Daily readiness to train is affected by many factors including sleep, illness and training load. Heart rate variability (HRV) readiness to train metrics typically rely on measurements taken immediately upon waking in the morning. We introduce an HRV readiness to train and a durability metric based on DFA alpha 1 (a1) measurements taken during exercise. These new metrics provide additional insights and do not require you to measure HRV upon waking.
We have changed the way we calculate readiness from DFA alpha 1. For the improved readiness calculation, see this post.
DFA alpha 1 (a1) is an index that measures the noise spectrum of your heart from your HRV data. We can use it as an indicator as follows: the lower a1, the more acute exercise stress your body is dealing with; in a sense it measures your internal effort. For example, if a1 crosses below 0.75, you cross your aerobic threshold. Once a1 drops further below 0.5, you cross your anaerobic threshold.
The correlation between a1 and aerobic and anaerobic thresholds was demonstrated via ramp test data. However, a1 can give us further insights into your readiness to train / recovery based on a simple observation:
If you put out less power/pace for the same a1 on a given day, you are not performing well compared to your current baseline.
Conversely, if your power/pace for the same a1 is higher than your current baseline, this is an indication that you're performing well and you might be particularly ready to train or race.
The relationship between fatigue and a1 was first noticed with cyclists and was recently studied more extensively with ultramarathon runners. The latter study showed a significant decrease in a1 over long activity durations at a given running pace.
To quantify the effect, we introduce pa the power/pace it takes to perform at fixed a1. pa does not rely on a ramp test. Instead, we determine pa from the product of the a1 and pace/power measurements roughly during the first 30 minutes of your workout. For a precise definition of pa, see the section below.
We can think of pa as a measure of your current fitness state. With pa, we can define Ra, a quantity that quantifies readiness to train / recovery as follows:

where the mean is built over all workouts within the last 30 days. The mean serves as the baseline.
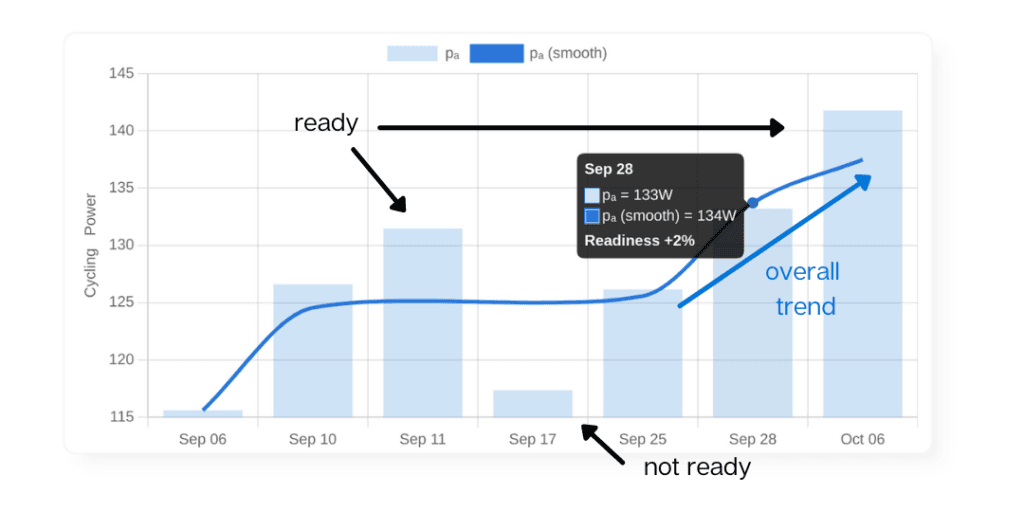
We automatically track your readiness to train in AI Endurance if you are logging HRV. Here is an example for cycling power:

Let's take a real world example: if the baseline is 220 W to operate at fixed average a1 but today you are only able to put out 200 W at the same a1, then Ra equals -10%. You are performing 10% below your baseline. This indicates you might be having a bad day and are not ready to train. If on the other hand Ra is positive, this indicates a good day and/or an overall improvement in your fitness.
From thousands of activities with high quality HRV data in our database, we see that Ra can vary significantly. Typical values for Ra lie between -20% and +20%. On average, AI Endurance users show an Ra of about +1% for both running and cycling. This can be interpreted as an aggregate performance improvement of +1% over a 2 week time frame.
In similar spirit to readiness to train, we can quantify an athlete's durability:
If you put out significantly less power/pace for the same a1 during the second half of your workout compared to the first half, this indicates a lack of durability for a given workout type and/or length.
Conversely, if your pace/power for a given a1 is constant throughout a workout, this indicates durability of the athlete.
Using pa, we can define durability as

The more negative Da for an activity, the less durability for that particular workout type and duration.
Da has some similarities with cardiac drift. Cardiac drift is the observation that heart rate rises for a constant effort due to a lack of durability. However, Da based on a1 measurements seems to be a much more precise and sensitive measure than cardiac drift based on our data. Rogers et al made a similar observation in their recent work with ultramarathon runners.
Let's take an example where you exercise for an hour at 200 W. If your average a1 to maintain 200 W is the same during the first half hour as during the second half hour there is no drift, Da=0%. You are showing durability for the 1 hour workout duration. Now, let's say you are doing a 3 hour workout instead and you are not well adapted to the duration. It is likely there will be a significant drift. For example, while during the first half you might have been operating at a1=0.8, the second half was more taxing due to accumulated fatigue and you were operating at a1=0.7. This results in a negative Da of a few percent points.
Apart from duration, the type of workout is also important to consider. If you are doing hard efforts in the first half of your workout, you might be more fatigued than usual in the second half of your workout. This might result in significantly more negative values for Da. The effect of external conditions such as heat, fuelling etc will be interesting to investigate, just as with cardiac drift.
Durability is most often negative. We find moderate amounts of drift of around -5% to -15% to be typical. On average, we observe about twice the amount of drift in cycling compared to running. This might be due to the typically longer duration of cycling activities.
HRV4Training, EMFIT, Oura and other apps use HRV measures such as rMSSD and sDNN to inform you about your readiness to train and your recovery. These are typically to be taken upon waking to be able to observe trends and make decisions about training.
This can be challenging as many of us have jobs to rush to, kids to tend to etc. Ra provides a convenient alternative to get more information about your recovery and fitness out of your workout. You only need to wear a heart rate monitor with good quality HRV data. We recommend Polar H10 with HRV logging enabled.
However, there is one important advantage of HRV morning measurements at rest over a1 based measures: they inform you about your readiness to train before your workout. Hence, we recommend using both kinds of measurements. This way, you gain maximum insights into your readiness to train and can make smart decisions about your training.
We also urge real-time a1 apps such as HRVLogger and Fatmaxxer to incorporate Ra and Da. These would provide you valuable information on when it might be better to alter or stop a workout early (or not even go beyond the warmup) if indications are that it would be counterproductive to your fitness.
Both Ra and Da give valuable feedback on the effectiveness of your training and help you get more in-tune with your body. Right now, you can only get these metrics with AI Endurance.
In the future, our machine learning models will also take into account readiness to train Ra and drift Da for each of your workouts with high quality HRV data. They can provide valuable insights for our AI to potentially modify and adapt your training plan.
We propose a definition for pa, the power/pace necessary to operate at fixed a1. The definition is based on the insights from thousands of activities with high quality HRV data in our database.
Let p be either power or pace of an activity. We are referring to pace as Grade Adjusted Pace (GAP), normalizing the elevation profile of the activity. pa is the product between the a1 and p measurements during a window defined by a starting index Ns, and ending index Ne:

We remove outlier measurements via an elliptical envelope in the a1 vs p plane. For calculating Ra, Ns and Ne are chosen such that the first 5 minutes of the activity and anything beyond 30 minutes are discarded for the pa calculation. We discard the first 5 minutes as this period is particularly susceptible to HRV artifacts. Beyond 30 minutes, drift may occur. For calculating Da, Ns and Ne are chosen to reference either the first or second half of the activity.
a1 measurements allow new insights into an athletes' physiology. The measurements are accessible, non-invasive and the analysis can be automated. While more research is required, we are excited to help you reap the benefits from this new metric for your training.

The world around us is changing, driven by technological advances that seek to improve our lives.

When it comes to triathlon training, nutrition plays a vital role in fueling your performance and optimizing your results. To help you reach peak performance, we have developed an advanced AI meal plan that takes into account your unique requirements, respects the calorie cost of your workouts, and accommodates your dietary preferences. With the power of evidence-based nutrition models, we ensure that your triathlon meal plan is tailored to support your goals.

by Markus Rummel. DDFA (Dynamical Detrended Fluctuation Analysis) is a new method to analyze the changes in your HRV data during exercise. It is an evolution of the DFA analysis based on the research in [1, 2] used by AI Endurance.

Use Zwift custom workouts to grow your FTP with a data-driven, personalized Zwift custom training plan from AI Endurance.