
Published Nov 11, 2024 · Updated Jul 22, 2026
by Grant Paling. So welcome back to my blog. As I approach 12 months of being coached by AI Endurance there is a lot to reflect on! So let’s get to it.
First, let me recap my triathlon season:
That last one is important, probably the most important. I thoroughly enjoyed training this year. I had a new sense of purpose, a new sense of direction, a new confidence.
AI Endurance played a huge part. It gave me a structure I never had before and allowed me to reach new heights I honestly never thought I could reach.
So what happened? How did I make such gains? Well, I’ve been diving back into some of my data to have a bit of a review…
It is a question I was intrigued to know. I didn’t really feel like I was training more – just training smarter. But what was the reality? To delve into this, I pulled my statistics from Strava (where I log everything, because if it’s not on Strava it didn’t happen right?) and looked at the period October to September for 2022-23 and then 2023-24. So how did it look?

Figure 1: comparing month by month, training volume in the past two seasons
The blue shows my 2022/23 data, whilst the orange shows my 2023/24 data.
So did I train more? Well, yes. In fact, there was overall a 20% increase in hours over 12 months. But interestingly, not really during the triathlon season itself (April to September). In that period, I only increased by 14 hours, so just over 2 hours per month on average, which is 30 minutes more per week. Not really an increase, and as you’ll see from the chart above, in July and September I actually did more activity in the previous year!
But look on the left of the graphic. Every single autumn and winter month, I did more. In March I did a 10 day “run as many kilometers as you can” challenge so that explains that – although I did that as best I could within my programme set by AI Endurance. All of this set me up really well for the season ahead.
Normally in winter, my training has been very unstructured. The past few years Zwift really helped in maintaining my cycling fitness (previously I had really had to build it back up from spring onward) but swimming had always dropped completely and even running, I hadn’t had that balance across all 3 sports.
AI Endurance changed all that last November and the proof is in the pudding! Immediately I had set up a plan to take me all the way to the European Championships in June and with that pre-season structure in place, I thrived. I actually upped my hours in April in the app but as you can see from the graph, I had upped the amount of available hours without really increasing dramatically beyond what I would normally do in Spring and Summer. I have a family, I have quite a demanding job. It wouldn’t have worked. I needed to train smarter not harder. Ok, well a bit harder too…
I love running fast. I love pushing to my limits on a bike. I even quite like swimming now.
I think one of the things I first noticed with AI Endurance was the amount of training at endurance pace or power. Whilst I knew that in theory, I really liked the fact I could always see how much of the different type of training I was doing versus what I should be doing.

Figure 2: AI Endurance really visualizes your week ahead and the type of workout(s) on each day
That helped keep me grounded in the process and that was something I never really could track before.
So that structure – albeit with the flexibility to move workouts around, adapt when I missed the odd workout – it was really the foundation for the season ahead.
So how much was my successful season down to me and how much was it down to the AI?
Well, that is what I’ll be exploring next time…
AI has great potential to help us as endurance athletes improve our training. In this post we will discuss how AI endurance training works.
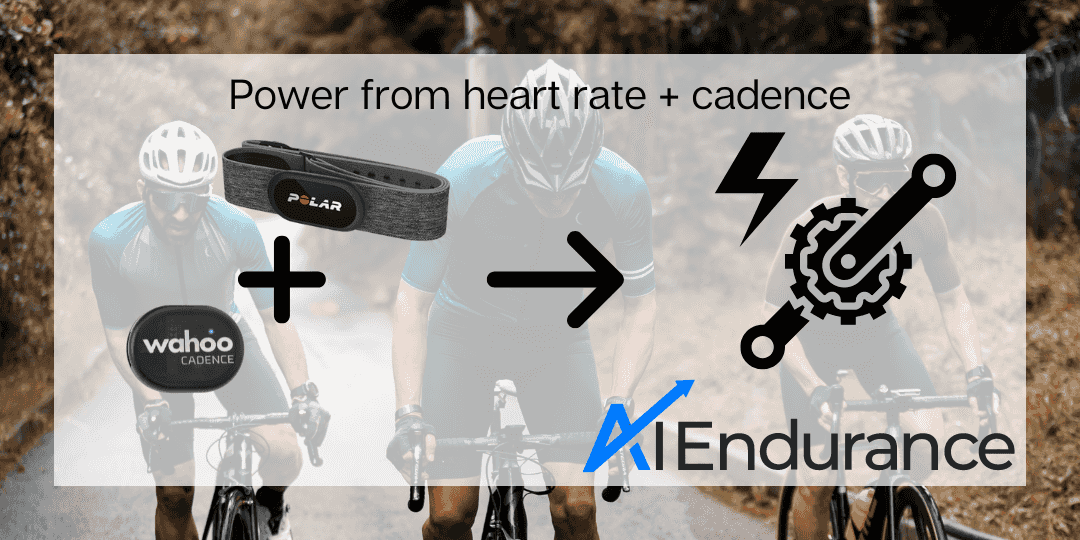
Power meters are costly and we often can't afford one on every bike we own. AI Endurance calculates cycling power from activities without a power meter using heart rate, cadence and DFA alpha 1. The results are generally more accurate than speed based estimates such as Strava's estimated power. All you need is a heart rate monitor and ideally a cadence sensor on your bike and AI Endurance will estimate your power for every ride.

by Markus Rummel. DDFA (Dynamical Detrended Fluctuation Analysis) is a new method to analyze the changes in your HRV data during exercise. It is an evolution of the DFA analysis based on the research in [1, 2] used by AI Endurance.
In this post, we give a short introduction to the running training zones and cycling training zones we use to structure your training. We use 5 training zones defined by pace for running activities and by power for cycling activities. AI Endurance calculates these zones for you individually based on your past training data.