
Before every workout you should know if you're actually ready for it. Everyone responds differently to stress, bad sleep and exercise fatigue - our new recovery model makes data driven decisions about when you should train and when you shouldn't - based on heart rate variability (HRV).
HRV studies [1, 2] show evidence that HRV guided training reduces the number of non-responders in a training population. While athletes who adapt their training based on HRV might not necessarily improve more than those who don't, a smaller fraction shows no improvement at all.
At AI Endurance we want to give you the best of both worlds:
In this context, we are introducing your personalized recovery model to AI Endurance.
There are various indicators that measure readiness to train. AI Endurance uses the following three measurements to assess your recovery:
Root mean square of successive differences between normal heartbeats (RMSSD) measures the variation in the time between heart beats. Generally, low RMSSD correlates with high stress/low recovery although the relationship can be more complex depending on the circumstances.
Trends in RMSSD correlate with recovery as shown in the sport science literature, e.g. [3, 4]. You can measure RMSSD 'at rest' during the night or upon waking up. This requires one of the following options:
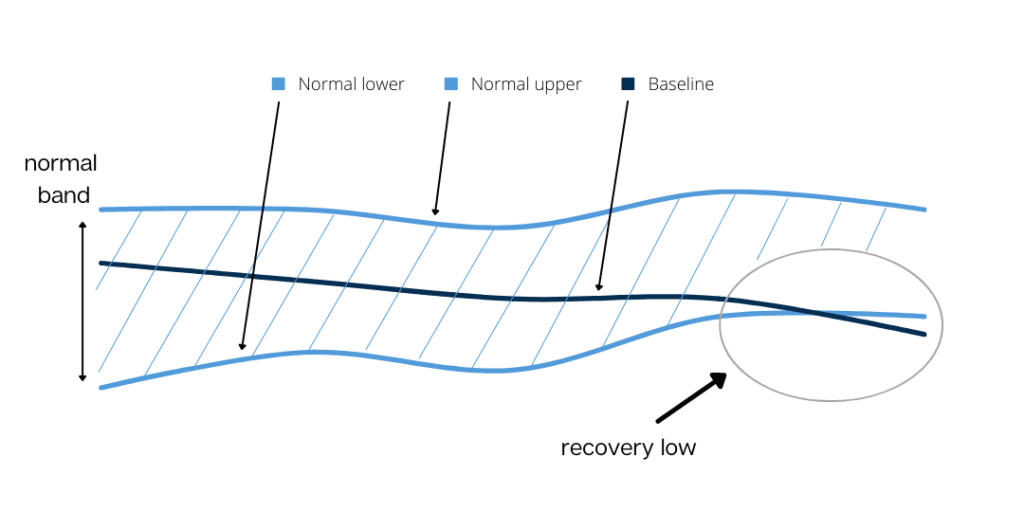
AI Endurance uses a 60 day normal vs 7 day baseline to asses your recovery from RMSSD. For example, if your 7 day baseline/average drops below the band of values defined by your 60 day normal, your recovery is indicated to be low. The normal band is defined via the 60 day average plus/minus the 60 day standard deviation.
Resting heart rate is either your minimum heart rate measured during the night or your heart rate upon waking up, consistently measured at the same time during your morning routine (e.g. laying down vs standing up). Once you measure HRV, resting heart rate can be easily calculated as a by-product. Otherwise it can simply be taken by hand or with a heart rate sensor. Generally, the higher your resting heart rate the less recovered you are [4].
AI Endurance uses a 30 day normal vs today's value to asses your recovery from your resting heart rate. For example, if today's value is above the band defined by your 30 day normal, your recovery might be low.
DFA alpha 1 (a1) measures how much stress your cardiovascular system is under during exercise. The lower a1, the more stress you are putting on the system. It can be used to assess readiness to train, durability and thresholds.
AI Endurance introduced pa, the power/pace it takes to perform at fixed a1 - think power multiplied by a1. If on a given day your pa is lower than usual, i.e. you're pushing less power for the same internal effort quantified via a1, your a1 readiness is low. See also [5].
In order to asses your recovery from a1, AI Endurance uses a 60 day normal vs a 7 day baseline. For example, if your a1 baseline is lower than the band defined by your normal, this suggests that you might not be well recovered.
AI Endurance's recovery model operates in 4 steps:
A measurement of your current recovery state via the above metrics (RMSSD, resting heart rate, a1) translates into a recovery state between 0 and 100%. A particular deviation of the baseline relative to the normal might describe different absolute recovery values for an individual. For example, athlete A might still be 20% recovered when the baseline crosses the normal while athlete B might only be 10% recovered.
Finding your individual HRV metric to recovery relationship is part of our personalized recovery model.
Apart from measured recovery via HRV metrics, your training stress is key in creating your personalized recovery model. AI Endurance measures training stress via external stress score (ESS). It grows with intensity and duration of your workouts - think one hour at threshold equals ESS of 100.
Our recovery model relates your training stress ESS to your recovery R via the following recursive formula:

It is natural to model recovery as an exponential decay process, and this is an approach used frequently in the scientific literature following the original model of Banister et al. [6, 7].
AI Endurance determines your personalized recovery model by finding a best fit of the recovery model to your historical data:
The model finds the k and τ that best fits your personal data and hence learns
We weigh the different metrics according to their evidence and accuracy. For instance, RMSSD is weighted twice as much as resting heart rate when fitting the recovery model.
When evaluating your daily recovery, we want to be conservative. We choose the minimum value of
to represent your daily recovery. This way, we accommodate stresses in your life that are not represented via training stress. The actual measured HRV recovery values always overwrite the model predicted ones. So a night of bad sleep and/or stress at work are taken into account for your training.
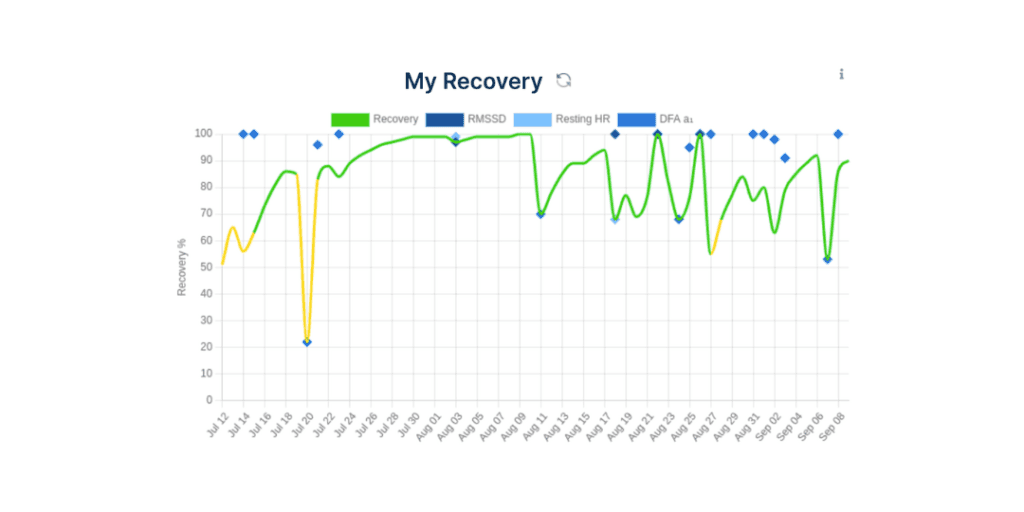
If your HRV indicated recovery is low, AI Endurance proposes to either move or skip a hard workout that was originally planned for the day in your training plan. We also show your historical recovery trends and measurements on your AI Endurance dashboard.
Make sure you collect high quality HRV data during your activities.
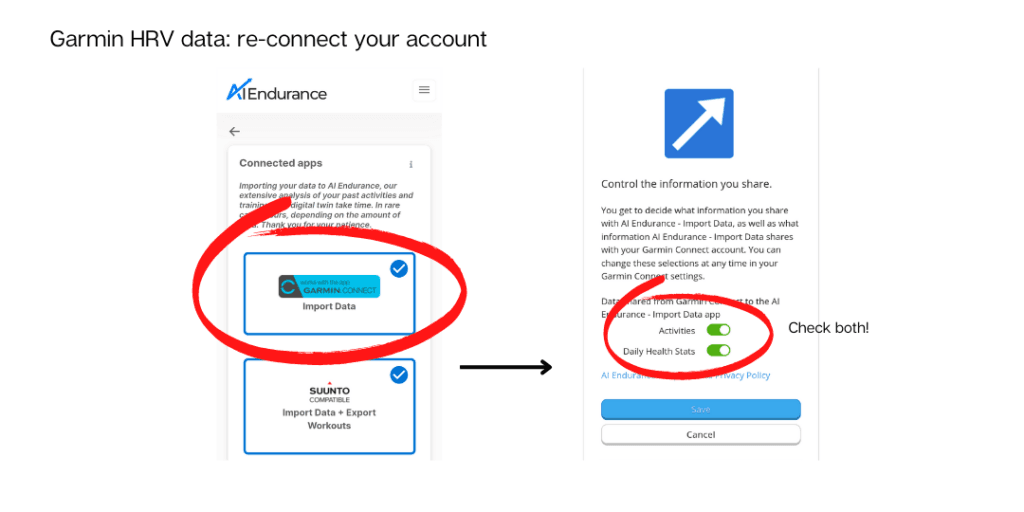
To get your Garmin HRV at rest data (RMSSD and heart rate at rest) into AI Endurance, simply make sure you are sharing Daily Health Stats from your Garmin Connect with AI Endurance. If you already have an AI Endurance account, make sure to re-connect Garmin Download and check Daily Health Stats. Garmin sends your data automatically to AI Endurance after you wake up in the morning.
For Suunto HRV at rest data, simply connect Suunto in your AI Endurance Apps page. Confirm that your Suunto watch model collects overnight HRV data.
You can also collect HRV at rest data with some Coros watches. To get the data into AI Endurance, connect Coros in your AI Endurance apps page.
For Polar, connect your Polar account to AI Endurance and we will sync your HRV at rest data multiple times a day.
To get your Oura HRV at rest data (RMSSD and heart rate at rest) into AI Endurance, simply connect your Oura account to AI Endurance.
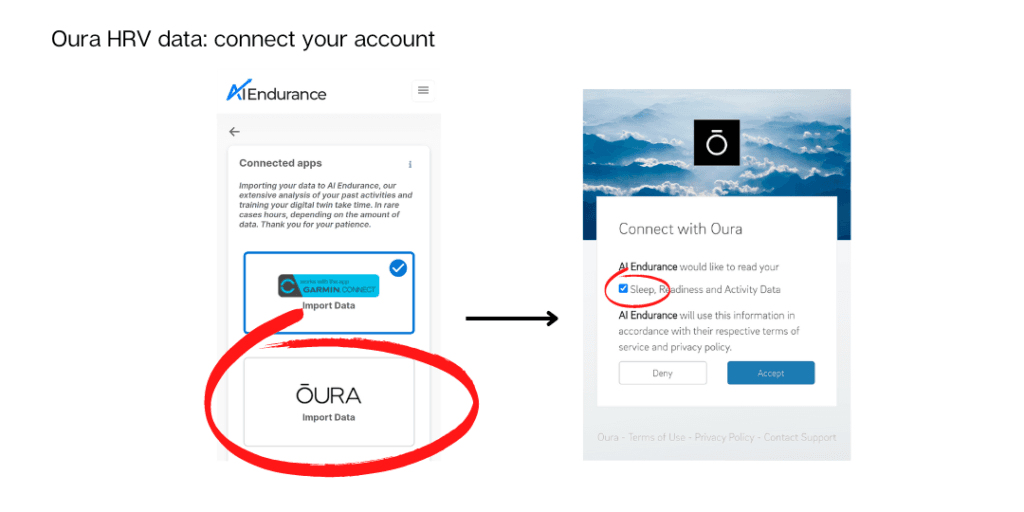
AI Endurance syncs with Oura multiple times a day. To synchronize your Oura data immediately, hit the sync button on your AI Endurance dashboard.
If you're using Whoop, simply connect your Whoop account to AI Endurance. Whoop will sync HRV at rest data automatically when your sleep period is over.
You can get your RMSSD and heart rate at rest measurements into AI Endurance via Intervals.icu or TrainingPeaks Premium while we are working on more direct integrations for you in the future.
For example, you can connect your HRV4Training account to TrainingPeaks and every HRV measurement you take with HRV4Training will be automatically pushed to TrainingPeaks right away. AI Endurance syncs with TrainingPeaks multiple times a day, or you can hit the sync button on your AI Endurance dashboard for an immediate synchronization.
Which metrics should you collect? Generally the answer is the more the better. However, not all of us have the luxury or patience that allow for a consistent HRV data collection a la HRV4Training.
If you're using the Apple Watch to collect overnight HRV data, please note that we currently have to use SDNN (Standard Deviation of NN intervals) instead of RMSSD because Apple only makes SDNN available through their API. You can switch between using RMSSD and SDNN in the account page.
Our personal favourite is Oura + a1 as it requires virtually no interruptions to your routine/life while still getting the benefit of proactively deciding whether to exercise or not before a workout.
Second favourite is the 'budget option' of a1 only, as it only requires you to buy a Polar H10 heart rate monitor and enable HRV logging on your Garmin or Suunto device. This continually collects data to train your personalized recovery model with the drawback that it does not inform AI Endurance about acute recovery setbacks such as a night of bad sleep as the data is collected during activity only. It still informs you if your recovery is generally low. For example, if you did a workout yesterday that indicated low recovery, your body would not have had enough time to be ready today. With a1, you also get all the benefits of automatic threshold and durability detection.
If you're using alphaHRV, you can get a readiness alert based on a1 in real time after the warm up of your workout. AI Endurance and alphaHRV have synced their algorithms so you should get similar scores in both apps.
To help you decide what data to collect, here's an overview:

We have exciting additions planned for you:
Stay tuned and thanks for reading!
In this post, we discuss staying motivated executing your cycling training plan when you’re not training for an event. Also we give an update on our training and give a status report on how AI Endurance’s performance predictions are stacking up against reality.

by Grant Paling. In my last blog, I closed the chapter on my European Championship race in Portugal. It definitely was an intense period leading up to, during and after the race. So many emotions, so much effort invested and then…what’s next?

When it comes to triathlon training, nutrition plays a vital role in fueling your performance and optimizing your results. To help you reach peak performance, we have developed an advanced AI meal plan that takes into account your unique requirements, respects the calorie cost of your workouts, and accommodates your dietary preferences. With the power of evidence-based nutrition models, we ensure that your triathlon meal plan is tailored to support your goals.
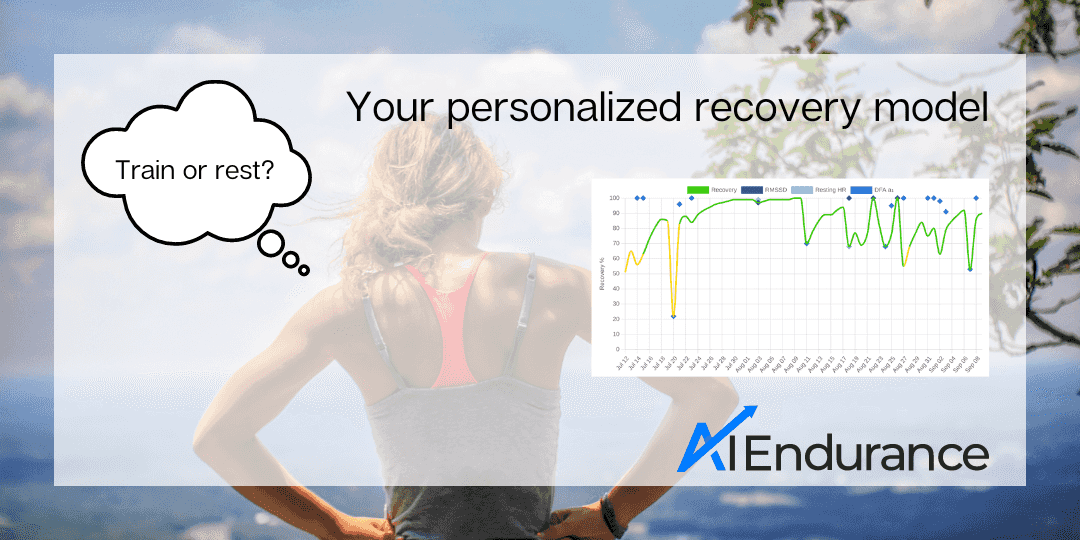
Before every workout you should know if you're actually ready for it. Everyone responds differently to stress, bad sleep and exercise fatigue - our new recovery model makes data driven decisions about when you should train and when you shouldn't - based on heart rate variability (HRV).