
Published Sep 18, 2024 · Updated Nov 11, 2024
by Markus Rummel. DDFA (Dynamical Detrended Fluctuation Analysis) is a new method to analyze the changes in your HRV data during exercise. It is an evolution of the DFA analysis based on the research in [1, 2] used by AI Endurance.
DDFA has been recently introduced by Suunto for real-time measurement of aerobic and anaerobic thresholds in Suunto devices via their new ZoneSense feature. Similar to DFA, it promises real-time evaluation of your aerobic and anaerobic thresholds and how those may change on a day to day basis and during an activity. For an alternative explanation of DDFA and ZoneSense, check out this post by the 5krunner.
One of the big advantages of (D)DFA is that it only requires you to wear a high quality heart rate monitor (Polar H10 or Suunto HRM) and enable heart rate variability (HRV) logging on your device. It is very cost efficient to use and non-invasive compared to other methods like lactate or gas exchange measurements that at this point require access to a physiology lab.
DDFA looks at your in-activity HRV data, specifically your RR intervals. RR intervals are the times between beats. For example, if your heart rate is 120 bpm, the time between beats is on average 0.5 seconds. However, it is actually never exactly 0.5 seconds, but for example 0.499, 0.501, 0.498, ... and there is a lot of information that can be deduced from these variations in your heart beat, hence the term heart rate variability.
HRV at rest data has been used for a while to assess recovery and readiness to train. In activity, HRV based methods such as DFA alpha 1 and DDFA are a more recent development.
Both DDFA and DFA are non-linear indices that indicate the level of noise and (anti-)correlation in the RR intervals. The basic idea of both concepts is that the more stress the heart is under, the more the correlation patterns in the RR intervals shift as quantified by the (D)DFA index. Various values of the index can be gauged against either gas exchange measurements (VT) or lactate (LT) in the lab to proxy exercise thresholds.
There are a few key differences on how DDFA is calculated [3, 4] relative to DFA [1, 2]. We'll go through the most important ones step by step. Note that this is the algorithm presented in [3, 4] and we don't know that Suunto ZoneSense is using exactly this algorithm but this is the information from the papers they are referencing. It should be noted that [3] has a rather small population of 15 study participants, hence conclusions shall be interpreted with caution.

This graph is from Figure 1 in [3]. It shows a(HR, s) as color coded as a function of scale s and heart rate HR. The black line takes the smoothened average over all scales. The dotted line marks the first and second lactate threshold while the cyan line marks the first DDFA threshold (crosses baseline) and second DDFA threshold (crosses minus 0.5).
While there are other small differences to the DFA algorithm, including for example smoothening of the a(HR) result, these are the main qualitative differences of the DDFA algorithm as outlined in [3, 4].

This is Figure 3 from [3]. It compares the DDFA method of evaluating the aerobic and anaerobic thresholds to lactate (used as the reference here), ventilatory thresholds (VT), HR max reserve and DFA alpha 1.
There are other recent approaches beyond DFA that may be promising.
alphaHRV is doing a great job in estimating respiration rate from in-activity HRV data. Combining respiration rate and DFA alpha 1 into a new quantity RRa1 (respiration rate divided by a1), can be used to determine thresholds: if respiration rate increases and or a1 decreases this means exercise stress is increasing. This method may allow for an individualized/baseline dependent aerobic threshold evaluation in a similar spirit as in DDFA.
Recently, the authors of [5] presented a study with 64 participants in which they compared the DFA algorithm with a Kubios proprietary algorithm that combines DFA alpha 1, with heart rate reserve and respiration rate to estimate thresholds. Interestingly, their combined algorithm performs better on the aerobic threshold (less bias and smaller error) compared to DFA alpha 1. The performance on the anaerobic threshold is similar to DFA alpha 1.
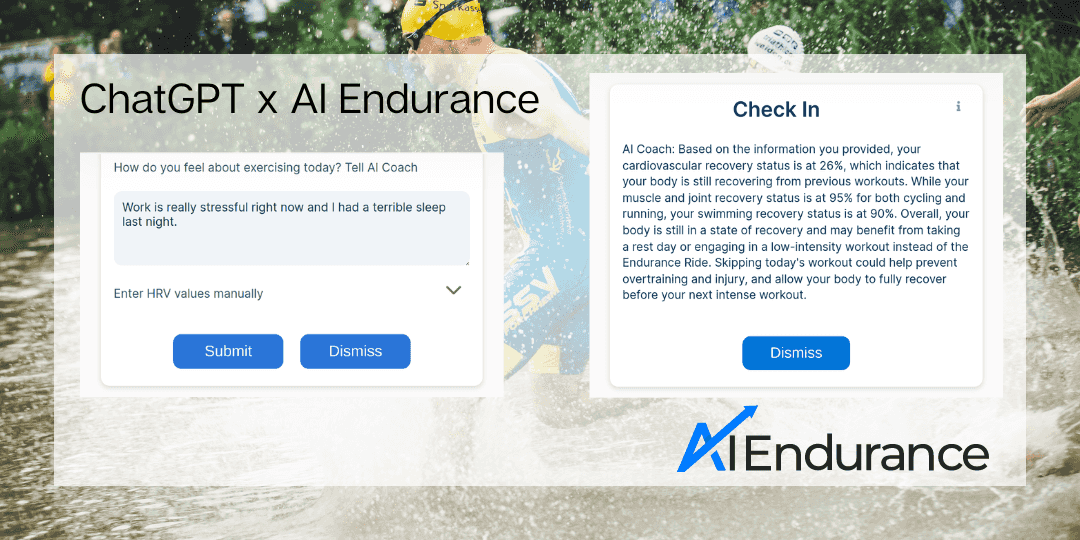
We explain how AI Endurance uses ChatGPT to help guide your triathlon, running and cycling training.
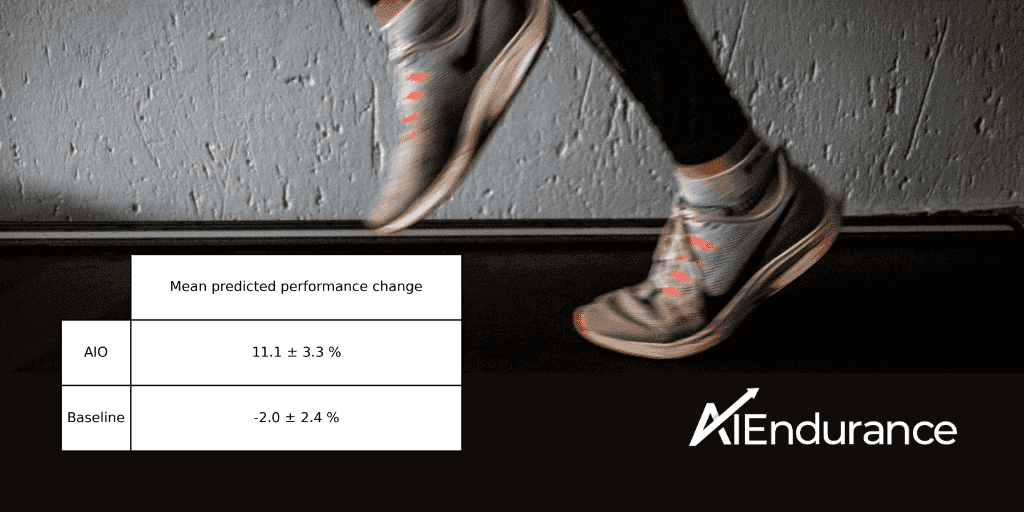
We compare polarized training, threshold training and AI optimized endurance training. AI optimized training yields the best results, followed by polarized training with threshold training in third. The results are inline with current exercise physiology research. If the training composition is not optimized to the individual athlete, substantially smaller gains are to be expected.
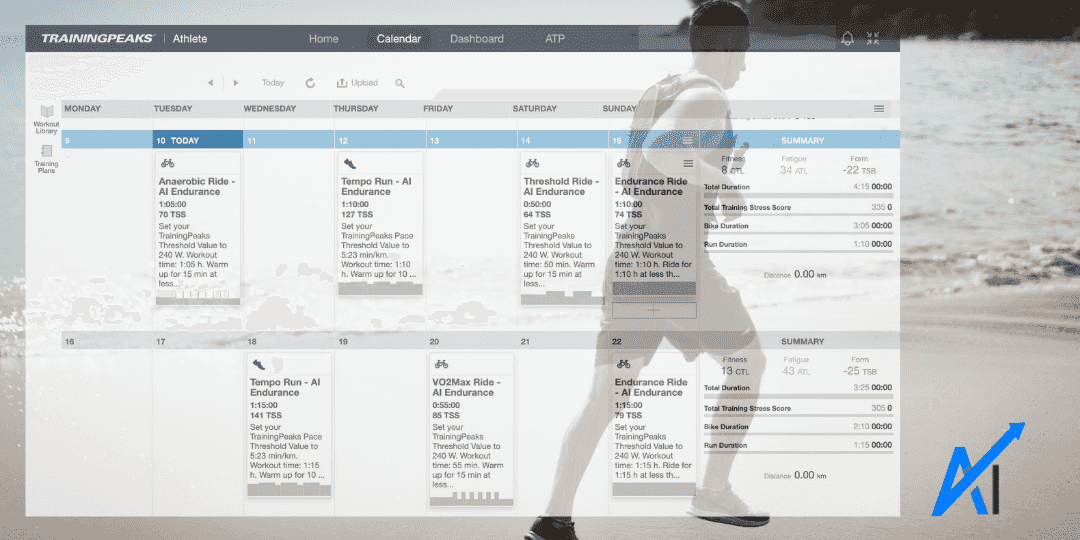
Get your AI Endurance best training plan into TrainingPeaks. From there, you can execute your TrainingPeaks workouts in Zwift and many other apps. Connect your AI Endurance account once and any changes will automatically be synced with TrainingPeaks.
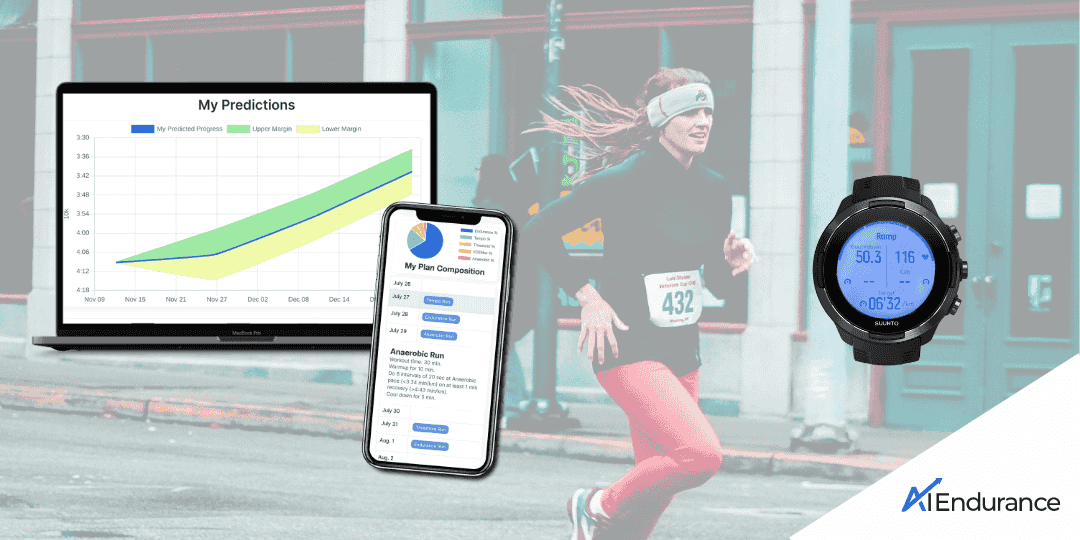
We show you in a few simple steps how to connect Suunto Guides with your AI Endurance account. You can get live workout instructions that are optimized to you by our AI. You can also easily determine your training zones and thresholds via a simple ramp test that utilizes your heart rate variability (HRV) data.